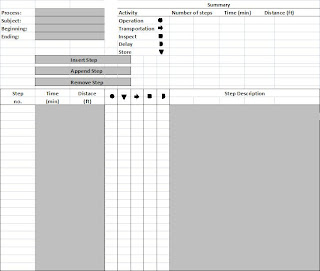
The process chart is an operations management tool that specializes in providing the guidelines for a thorough but simple breakdown of any given process. It breaks down a process into different tasks, each attributed with their respective roles, distances and steps required, and time estimations on completion.
There are five possible roles that a task can be categorized into1
- Operation - an act or instance, process, or manner of functioning or operating.
- Transportation - moving from one place to another.
- Inspect - to examine with the intention to make sure standards are met.
- Delay - a momentary pause in the process, whether mandatory or unforeseen
- Store - to temporarily hold in place
 Figure 1.1 - Empty process chart
Filling Out the Chart
To illustrate how this useful operations management tool works, take a simple process like preparing a unit of airline food:
- Obtain tray from basket (10 seconds - Transportation - 5 ft)
- Obtain food from refrigerator (1 minute - Transportation - 25 ft)
- Place food in the tray (1 minute - Operation)
- Make sure the it is not overflowing or undersized (20 seconds - Inspect)
- Place aluminum foil over tray (1 minute - Operation)
- Store tray for the airline to pick up (1 minute - Transportation - 25 ft)
 Figure 1.2 - Process chart being filled out.
Afterwards, fill out the summary to generate a brief synopsis of the process. This will provide the grounds for an accurate analysis which in turn allows relevant insight on how to improve the process.
Analysis and Optimization
In this example, analysis of the process can lead to a conclusion that the distance traveled is a very inefficient part of the process. It is a far distance to travel and uses quite a bit of time comparative to the other steps. By identifying the problem area using a process chart, it can shed light on which area requires fixing. In this case, optimization of the process can be done in a simple way--just move the fridge close to the station where the other steps take place.
No comments:
Post a Comment